October 9, 2018
Getting information off the internet is like taking a drink from a firehose—Mitchell Kapor
The goal is to turn data into information, and information into insight —Carly Fiorina
It is a capital mistake to theorize before one has data. Insensibly, one begins to twist the facts to suit theories, instead of theories to suit facts—Sherlock Holmes
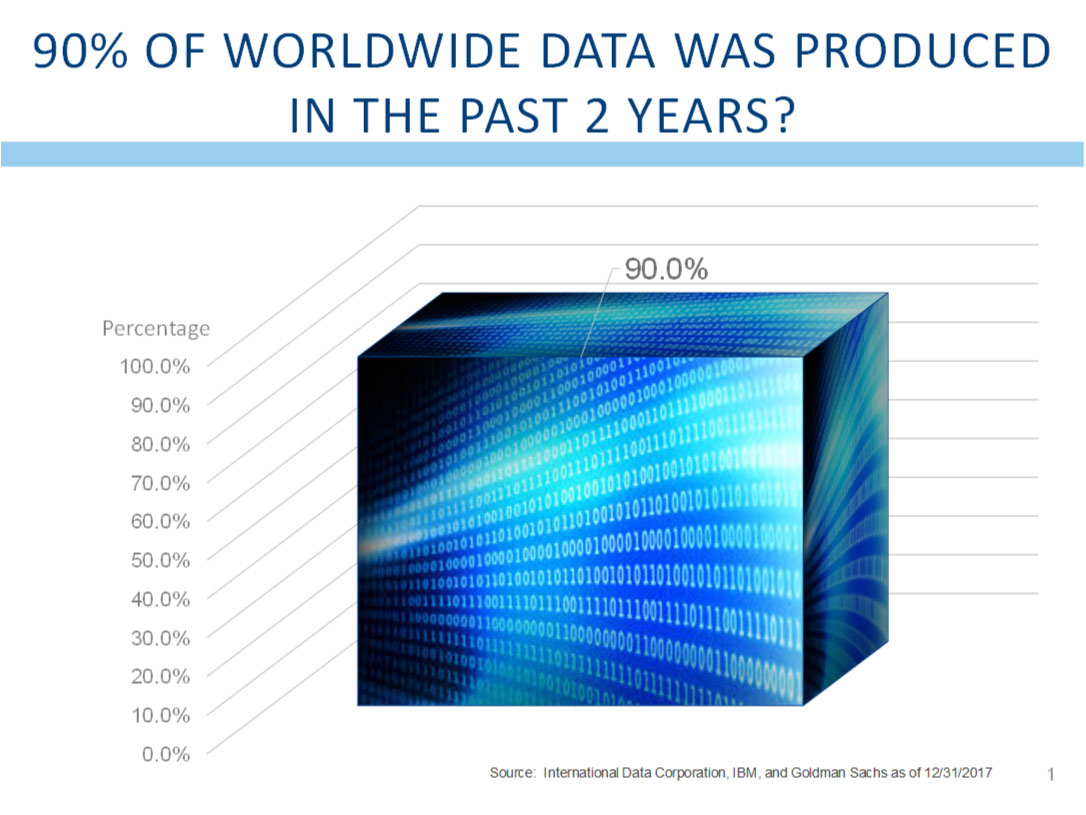
At a recent conference, we were asked what percent of worldwide data was produced in the past 2 years. According to the sources, the answer is 90%. The amount of data is doubling annually, and in several years it is expected that we will generate 128 times more information. Further, the presenters suggested that only two percent of that data is currently being analyzed. We feel there is a downside to this data production. Companies like Facebook have been hacked regularly, and the number of people whose data has been inappropriately shared is always in the tens or perhaps hundreds of millions. Still, these facts made me think about how this data reflects the progress society has made over the past 100 years.
In 1899, the Commissioner of the US patent office reportedly sent his resignation to President McKinley, and urged that the office be closed because “everything that could be invented has been invented.” IBM, a company founded 12 years later, has accumulated more than 250,000 patents since that time.
Starting with health and well-being, life expectancy has increased by about 25 years over the past century. From about 53 at the end of WWI, US life expectancy is now just over 78 years. This is due to many factors that have changed and improved lives. Fewer people work in factories, and those factories are safer. Fewer people die in car crashes as the advent of seat belts and airbags have saved lives. Cures and treatments for cancer were invented and implemented, and cancer is no longer the death sentence it once was. Advancements in medical care continue to both extend lives, and to make significant improvements in the quality of those lives.
Roads, cars, planes, and trains have made the world smaller and have brought people closer together. Who would have thought that the first manned flight of a heavier-than-air craft that covered 120 feet by Orville and Wilbur Wright would lead to an aviation industry. Today more than 840 million passengers travel more than 1.4 trillion miles per year. 66 years after the first flight, Apollo 11 landed on the moon, some 240,000 miles from earth. How is that for technological innovation!
From working hours that were dependent on the sun, man has adapted and increased productivity through the use of artificial lighting. Whale blubber was first used as a lighting source, even as it was expensive and not very safe. That was soon replaced with paraffin and gas lamps, which were cheaper and more readily available. Eventually that technology was replaced with electric lights. The cost of lighting one’s home has continually declined, and now represents the smallest percentage of income in the history of mankind.
Perhaps most important in the history of modern people is technology. Technology has had an unfathomable impact on mankind. I am old enough to have been required to do a slide rule problem every day at the beginning of my high school calculus class. My father promised to purchase pocket calculators for us when the price of the Texas Instruments SR-50 dropped below $100 each (not an insignificant sum in 1976). I was the second person in my class to do the daily slide rule problem with a calculator. Today, simple electronic calculators can be purchased on Ebay for $0.85. How is that for deflation!
Today your iPhone has more power than was used by NASA to put Apollo 11 on the moon in the summer of 1969. Your cell phone gives you access to more immediate information than President Kennedy had during the Cuban Missile Crisis.
Technology keeps getting cheaper and more ubiquitous. Your phone talks to your thermostat to adjust the temperature in the room. Your refrigerator can tell you when you need milk. Your watch can call 911 if you fall. Amazon has ruined it for all vendors around the globe. What do you mean I cannot have my goods within two business days?
There are two points to this discussion. First is to briefly take your mind away from Supreme Court nominees, trade wars, midterm elections or children separated from their parents. The most probable outcome of the midterm election is a divided government, something that has occurred more than 60% of the time. Even if the Democrats were fortunate enough to win a majority in the Senate, something that is statistically very difficult, there would still be a divided government. The President could veto any legislation he disagreed with, and it is unlikely that the Senate could overcome that veto. The most likely outcome of the mid-term election is that nothing will get done until after the 2020 election. That means that nothing good will get done, but it also means that nothing bad will get done. The economy is growing nicely, and is unlikely to need any additional stimulus, and nor will the existing stimuli be revoked. The political outlook for the next two years is unlikely to lead to any meaningful changes, and the status quo, from where we are situated, is not such a bad outcome.
The second reason to bring up the progress made over the past 100 years is to remind us of all the progress made. Humans have been remarkably productive and innovative. According to the Gates Foundation, since the start of the 21st century, more than 1 billion people no longer live in abject poverty. Does anyone really believe that innovation is over? Should we close the patent office again? If anything, the pace of innovation seems to increase by the day. Today, a free app can help you avoid traffic and get home faster. You can summon a car to take you home from a night on the town, and it will pick you up precisely where you stand. Gene therapies are on the cusp of curing cancer, not just treating it. Imagine reprogramming the AIDS virus to attack cancer cells. This is exactly what is happening today.
Whether you dislike the last president or the current one, there is much to be excited about. The price of determining an individual’s genome, the genetic code that can determine one’s susceptibility to various diseases and ailments, initially cost about $1 billion in 2003. Now, that same information can be compiled for about $1,000. This should lead to more cures, to longer more productive lives, and to better outcomes for most illnesses. The future brings great promise. Forget the differences between you and your neighbor who supports the other candidate. Focus on the human potential for growth and innovation, and that should lead to many excellent long-term investment ideas.
Perhaps we have deviated too far from the data points we follow. Perhaps, like me, you enjoy seeing some of the economic data that drives our decisions. We would be remiss to hold back on our guilty pleasure. Here are some of the data points that help us guide portfolio decisions as we look ahead through this quarter and into the new year:
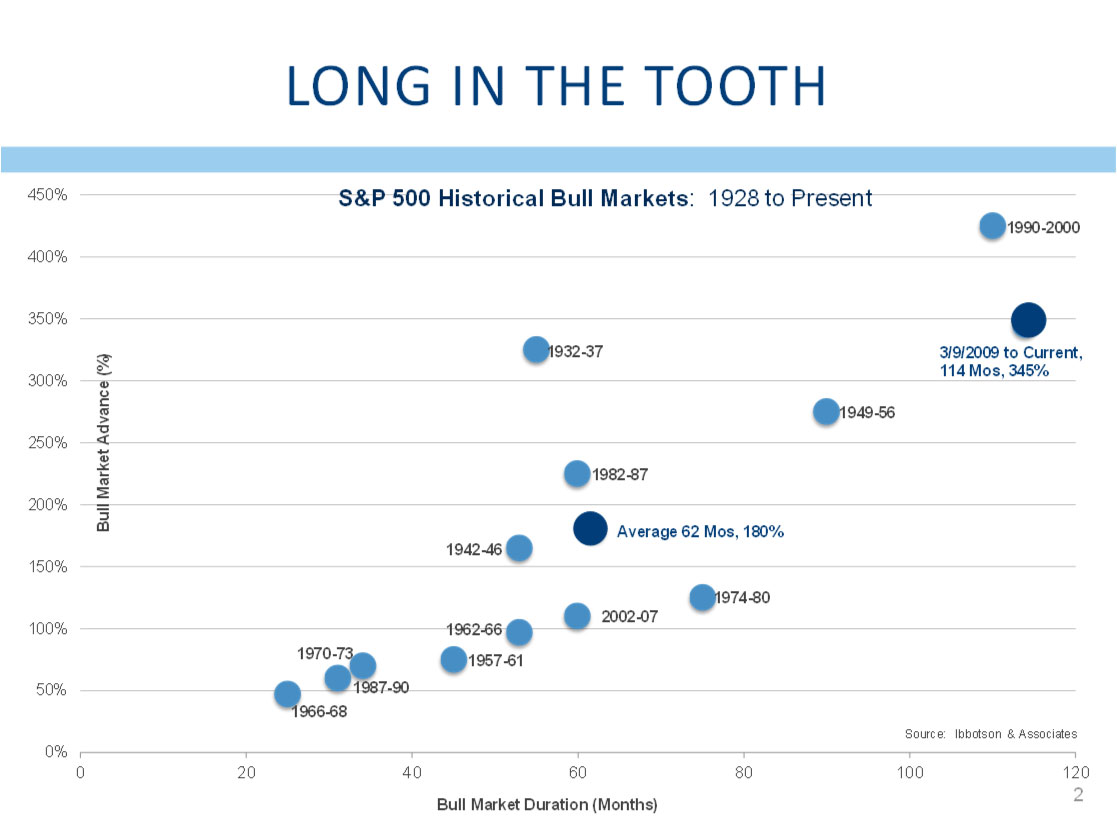
Our recovery, currently 114 months long, is the longest in history (the Ibbotson data goes back to 1926). It is one of the most profitable, although the run from 1990 to 2000 was more profitable. Still, this has been a wonderful cycle in which to participate.
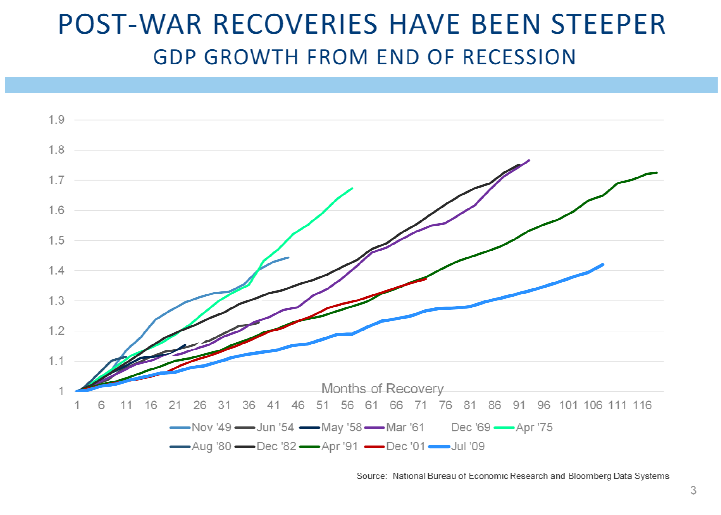
While the recovery has been long, it has actually been quite shallow. On average, post-war economic cycles have experienced about 49% GDP growth from the beginning of the cycle. Despite the length of this cycle, GDP growth has only expanded by 42%, somewhat below average. Other cycles that were longer showed dramatically greater expansions in GDP growth. This may be a reason to suggest that this cycle has further to go.
The lack of an overheating economy has enabled the Fed to take a more relaxed stance as they have begun raising interest rates. Fed Funds data goes back to the early 1970’s, and on average, the Fed has increased rates by more than 6% each cycle. To be fair, there were a few cycles where interest rates were increased very aggressively by then-Chairman Paul Volker as he successfully broke the back of inflationary pressures. Even when compared with more recent cycles, the rate hikes recently undertaken by the Fed have been much more muted. So while economic growth has been somewhat muted, so too has been the policy response. It is hard to argue that the Fed has been too aggressive and is making a significant policy mistake with its actions so far.
We have repeatedly written about indicators that have helped to predict when a recession might be on the horizon. After all, as the number of months of this expansion reaches into record territory, it is understandable that investors’ greatest concern is when this cycle will end. We watch countless economic data points and have several excellent indicators that have helped indicate when a recession may start. It is important to reiterate that none of those indicators is suggesting a recession is on the horizon. This reinforces the notion that this expansion has not been so excessive to require aggressive action by the Fed. While markets might correct, the greatest declines come with recessions, and we do not expect to see a recession start this year, and 2019 looks increasingly unlikely as well.
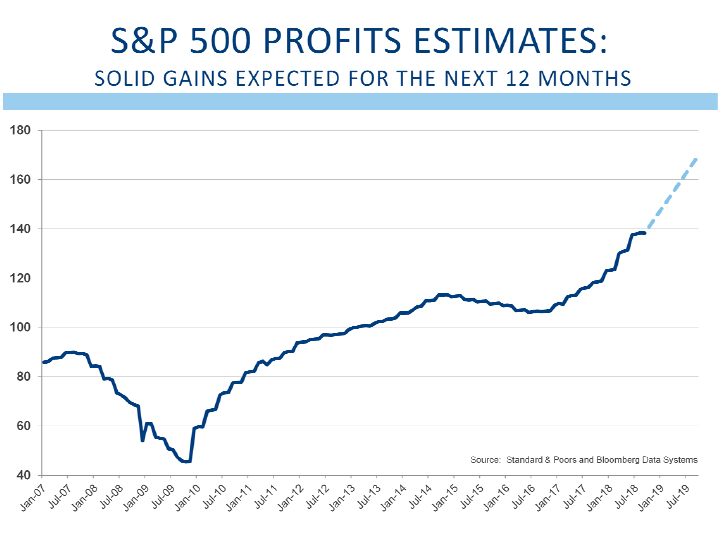
In fact, the data that we look for to support the market seems surprisingly in-tact. Over the long term, stock prices are driven by corporate earnings. Valuations ebb and flow, as does investor sentiment, but companies that grow earnings are likely to be rewarded with higher share prices. Here the news is exceptional. Over the past two quarters, S&P 500 company earnings have grown by 27% as compared with the same quarter last year. That growth is driven by higher margins emanating from the lower tax rates, higher revenue driven by solid economic growth, and corporate buybacks. As we enter the reporting season for the third calendar quarter, expectations are for similar growth again. Earnings growing at more than 20% in the 10th year of an expansion is an extraordinary occurrence. It is hard to find data that suggests this expansion is quickly coming to an end.
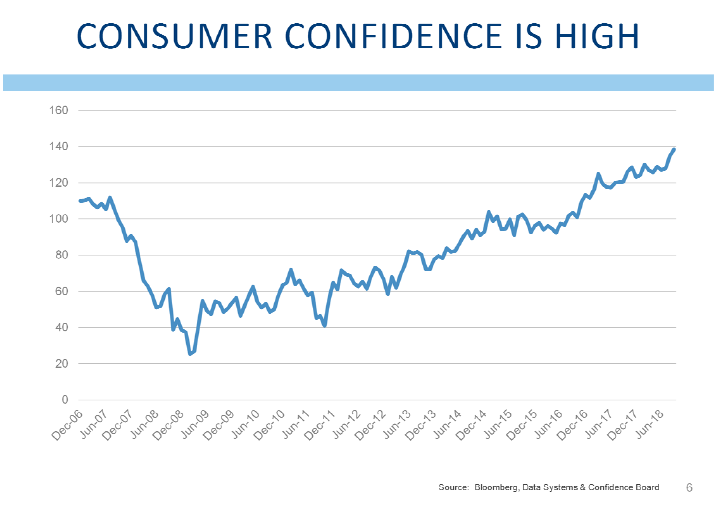
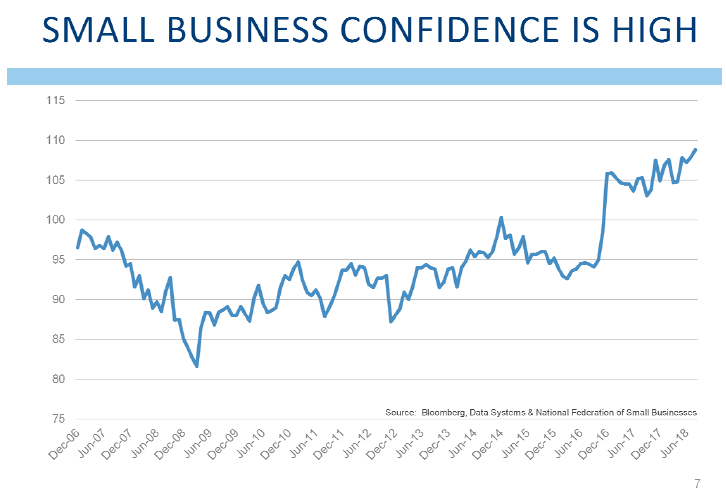
We also look at confidence to see if market players are willing participants, and here too the news remains solid. Consumer confidence is at a new cycle high, and is as high as it has been since the fall of 2000. Small business confidence is at a record high, eclipsing the previous highs of late 1983 (this series goes back to 1974). These numbers reinforce the notion that this cycle is not coming to an end.
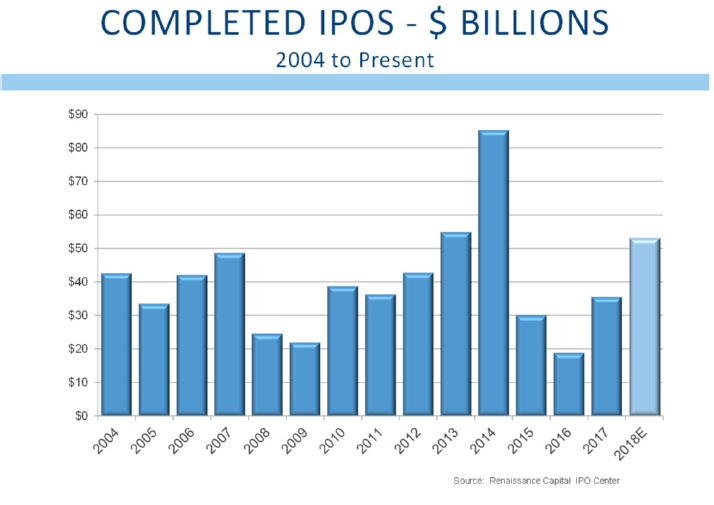
While we remain encouraged, we do see some signs that might suggest the market is getting tired. It is important to reinforce the fact that market corrections without recessions are much shallower and much less damaging. Still, we see some signs that give us a reason for some concern. Typically, when many new companies come to the market and issue stock for the first time (an initial public offering or IPO), that is a sign that the market is getting close to a top. Young companies tend to want to launch their stock before the next downturn sets in because another favorable market could be several years away. IPOs are up 62% this year as compared with last year. This year looks like it will be one of the heaviest years of new issues in the last 15. Only 2014 was higher.
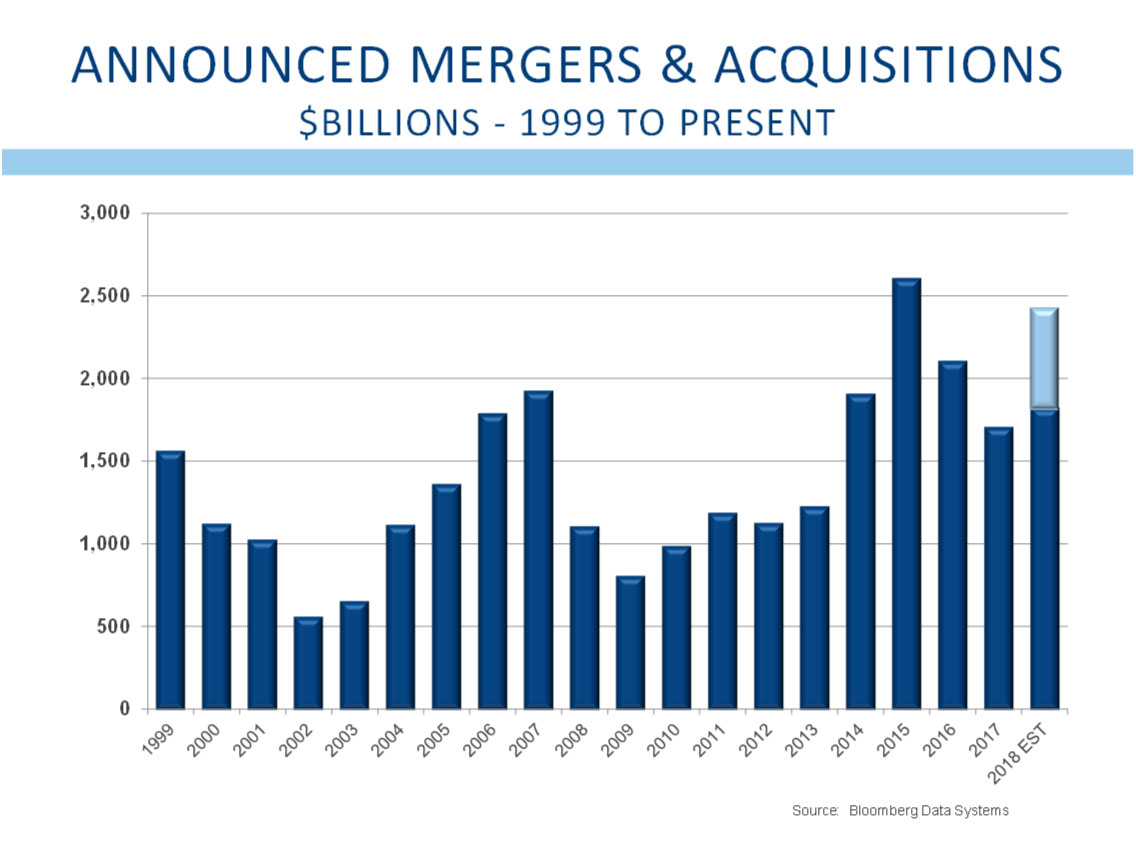
Heavy merger and acquisition activity is another sign that the market may be getting close to a peak. Sometimes company managers feel compelled to merge with other companies if they feel that their growth or prospects have not been as strong as some competitors. Some mergers are completed as an act of defense rather than offense, and this activity tends to be more prevalent later in the economic cycle. Merger and acquisition activity is projected to be the second strongest year over the past 20. Only 2015 was higher.
The borrowing costs for lower quality borrowers tend to rise as markets approach a peak. Many of our credit market indicators have come off bottoms reached early this year, and nearly all of them have increased this year. It is important to reiterate that there do not seem to be any credit problems in the economy, but we must also report that credit spreads have tightened this year. This is also one of those indicators that tend to give warning signals of the potential for a market top.
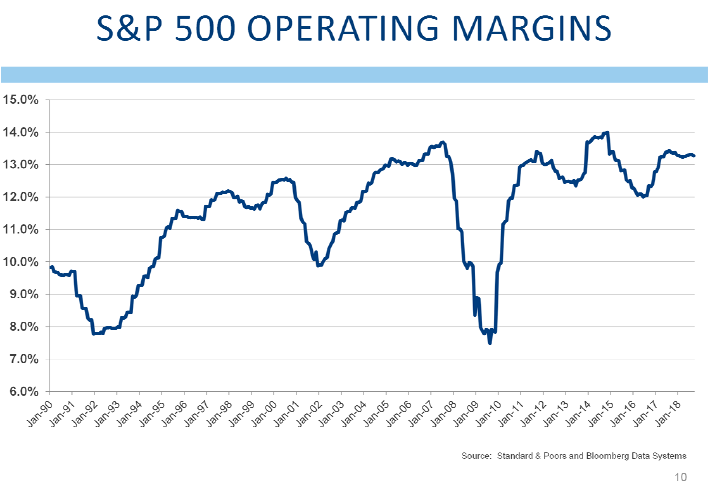
Operating profit margins are near peak levels, and this measure has seldom been higher. While we do not have any indication that operating margins are peaking, this tends to occur late in the cycle, and we would be remiss if we did not suggest it is one of those data points requiring attention. We do know that operating margins have benefitted from lower tax rates, but we can’t help but wonder whether higher labor costs, higher energy prices, and higher input prices due to tariffs will push margins lower?
The number of stocks participating in the market’s move continues to decrease. This year, like years past, has been dominated by technology stocks and other names growing very rapidly. Over the past several weeks, it seems as if these companies are losing ability to lead the market. For a brief time, it seemed as though financial stocks would take the lead, but there has been no follow-through, and the weak performance of the financial stocks is not a good sign. Why, if the economy is doing well, are banks and brokers not able to help lead the stock market?
More recently, energy stocks have started to lead, but here too recent attempts at market leadership have not been long lasting. Weakening leadership and a smaller number of stocks participating in the market’s gains are further signs that the market may be struggling.
One member of our investment committee has referred to this as a rolling correction. Stocks in different industries are struggling, while the market overall holds on and even makes modest progress higher. He suggests that a rolling correction is better for investors than a full market correction where companies in all economic sectors and industries are declining all at once. We admit his argument has merit, and so far the rolling correction has been the path of least resistance.
While we see some signs of a market that seems tired after nearly 10 years, we do acknowledge that several meaningful signs of a market top are conspicuously absent. Markets tend to peak when nearly all investors get exceedingly bullish. Near the top there is typically an air of speculation, and investors frequently gloat about how “easy” it is to make money in stocks. It is never easy to make money, and it is never easy to make money as an investor. When people at cocktail parties are bragging about easy money, please call us. This is a sign of a top that usually requires attention. Fortunately, signs of speculation and retail investors’ affinity for the stock market remains absent at this time.
Signs of a recession remain missing. This bull market is one of the longest ever. It has been willing and able to climb the proverbial wall of worry. The Fed is tightening, but the market goes higher. The yield curve flattens, and the market goes higher. Trump is elected and the market advances. Supreme court nominees are heavily scrutinized and the market ignores the distraction. Midterm elections are on the horizon, but the market recognizes the outcome is a return to the normalcy of a divided government. There are some signs that the market is tired, but signs of excess speculation are missing.
Corporate earnings are strong, and confidence is high. Economic growth remains robust especially here in the US. Valuations are middling, and this expansion is one of the longest in history. Still, we recognize that expansions do not die of old age. Expansions typically end with policy mistakes or external shocks. The Fed is raising rates, but the pace of these increases is as shallow as any time in the past 50 years. A correction is possible for stock market investors, but any correction that might occur is likely to be fairly mild.
It is easy to get distracted by political noise. The market does not care about the outcome of the mid-term election, and neither should we. Ignore the partisanship and focus on the potential for mankind to make amazing advances over the next few decades. Finding some of these themes and investing in them is likely to provide solid returns. This is where our focus continues to be.
As always, it is important that we know of any changes in your financial situation. Please feel free to call us if you have any questions or comments regarding your investment portfolio.
Bennett Gross CFA, CAIA
President
Disclosure
L&S Advisors, Inc. (“L&S”) is a privately owned corporation headquartered in Los Angeles, CA. L&S was originally founded in 1979 and dissolved in 1996. The two founders, Sy Lippman and Ralph R. Scott, continued managing portfolios together and reformed the corporation in May 2006. The firm registered as an investment adviser with the U.S. Securities and Exchange commission in June 2006. L&S performance results prior to the reformation of the firm were achieved by the portfolio managers at a prior entity and have been linked to the performance history of L&S. The firm is defined as all accounts exclusively managed by L&S from 10/31/2005, as well as accounts managed in conjunction with other, external advisors via the Wells Fargo DMA investment program for the periods 05/02/2014, through the present time.
L&S claims compliance with the Global Investment Performance Standards (GIPS®). L&S has been independently verified by Ashland Partners & Company LLP for the periods October 31, 2005 through December 31, 2015 and ACA Performance Services for the periods January 1, 2016 to December 31, 2017. Upon a request to Sy Lippman at slippman@lsadvisors.com, L&S can provide the L&S Advisors GIPS Annual Disclosure Presentation which provides a GIPS compliant presentation as well as a list of all composite descriptions.
L&S is a registered investment adviser with the U.S. Securities and Exchange Commission (“SEC”) and is notice filed in various states. Any reference to or use of the terms “registered investment adviser” or “registered,” does not imply that L&S or any person associated with L&S has achieved a certain level of skill or training. L&S may only transact business or render personalized investment advice in those states and international jurisdictions where we are registered, notice filed, or where we qualify for an exemption or exclusion from registration requirements. Information in this newsletter is provided for informational purposes only and should not be construed as a solicitation to effect, or attempt to effect, either transactions in securities or the rendering of personalized investment advice. Any communications with prospective clients residing in states or international jurisdictions where L&S and its advisory affiliates are not registered or licensed shall be limited so as not to trigger registration or licensing requirements. Opinions expressed herein are subject to change without notice. L&S has exercised reasonable professional care in preparing this information, which has been obtained from sources we believe to be reliable; however, L&S has not independently verified, or attested to, the accuracy or authenticity of the information. L&S shall not be liable to customers or anyone else for the inaccuracy or non-authenticity of the information or for any errors of omission in content regardless of the cause of such inaccuracy, non-authenticity, error, or omission, except to the extent arising from the sole gross negligence of L&S. In no event shall L&S be liable for consequential damages.
The S&P 500 index is a free-float market capitalization weighted index of 500 of the largest U.S. companies. The index is calculated on a total return basis with dividends reinvested and is not available for direct investment. The composition of L&S’ strategies generally differs significantly from the securities that comprise the index due to L&S’ active investment process and other variables. L&S does not, and makes no attempt to, mirror performance of the index in the aggregate, and the volatility of L&S’ strategies may be materially different from that of the referenced indices.
L&S’ current disclosure statement as set forth in ADV 2 of Form ADV as well as our Privacy Notice is available for your review upon request.