October 14, 2019
Those that respect the law and love sausage should watch neither being made.
— Mark Twain
It is hard to imagine that there are thirteen more months before the presidential election. How will we ever survive? Perhaps the British have it right that candidates have only a few weeks to make their case to voters once an election has been called. To suggest that election fatigue is not already an issue would be unrealistic. How many more hours of debate can we watch? How many more emails requesting money can we tolerate?
As much as our political beliefs impact our thought processes, the reality is that the president has a much smaller impact on the outcome of financial markets than many of us have come to believe. In fact, investing based on your political beliefs may be hazardous to your wealth.
It is interesting to note that the annualized return for the S&P 500 during the Obama administration (measured from the day after election day 2008 to election day 2016) was 13.1% per year. That includes the devastating impact of the Great Recession and an almost 30% decline from election day to the bottom in March of 2009. In contrast, the annualized return of the S&P 500 since Trump’s election has been 13.5%, not materially different.
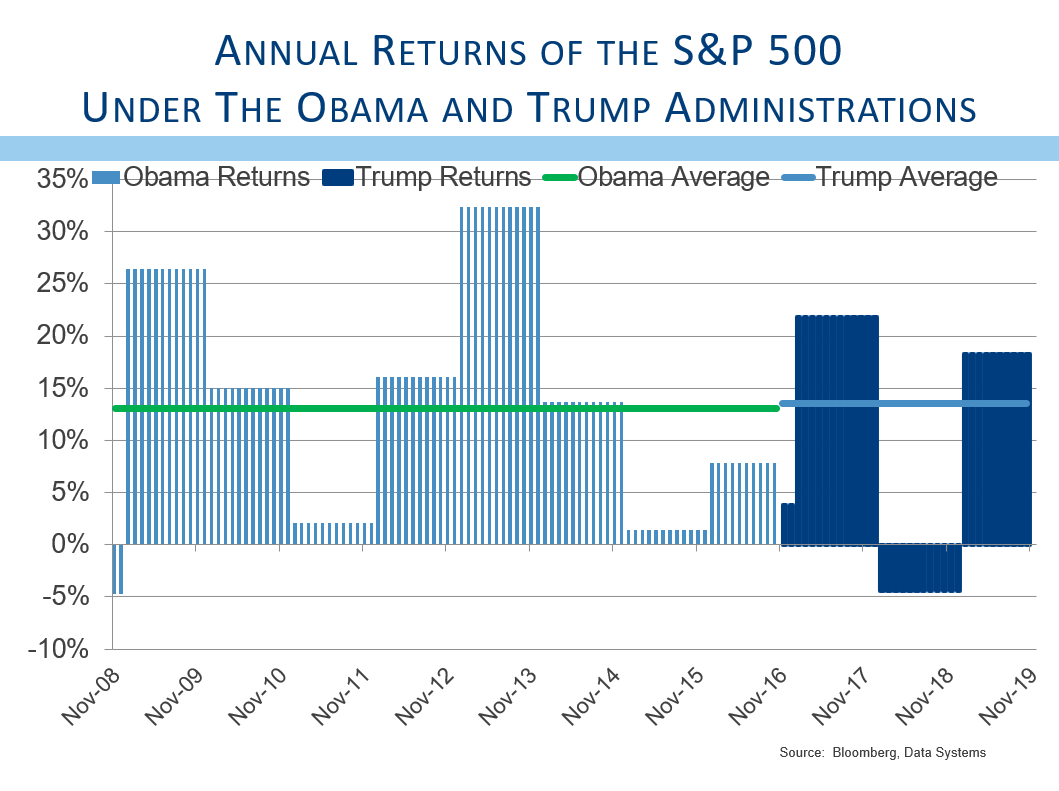
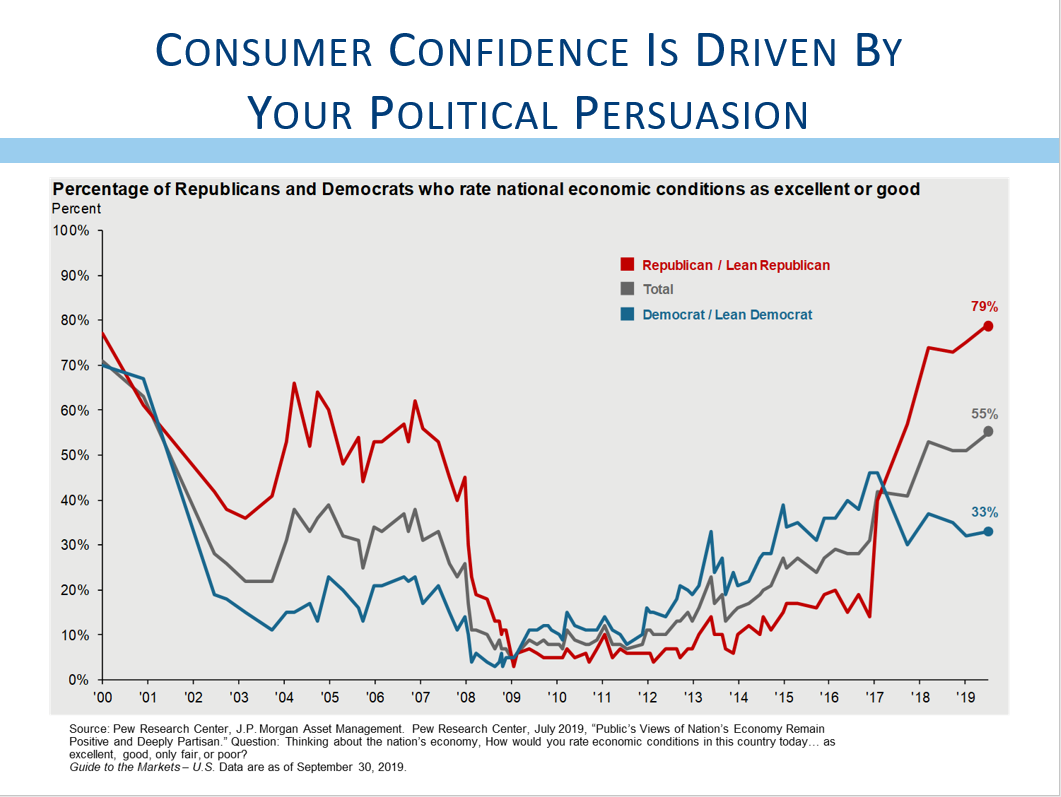
Recent studies showed that Democrats have been more negative regarding the economy and outlook since Trump was elected. The same is true for Republicans during the Obama administration. The reality is that both Republicans and Democrats should have put their personal beliefs aside and remained fully invested in the stock market while the economy shifted from recession to one of the longest expansions in history.
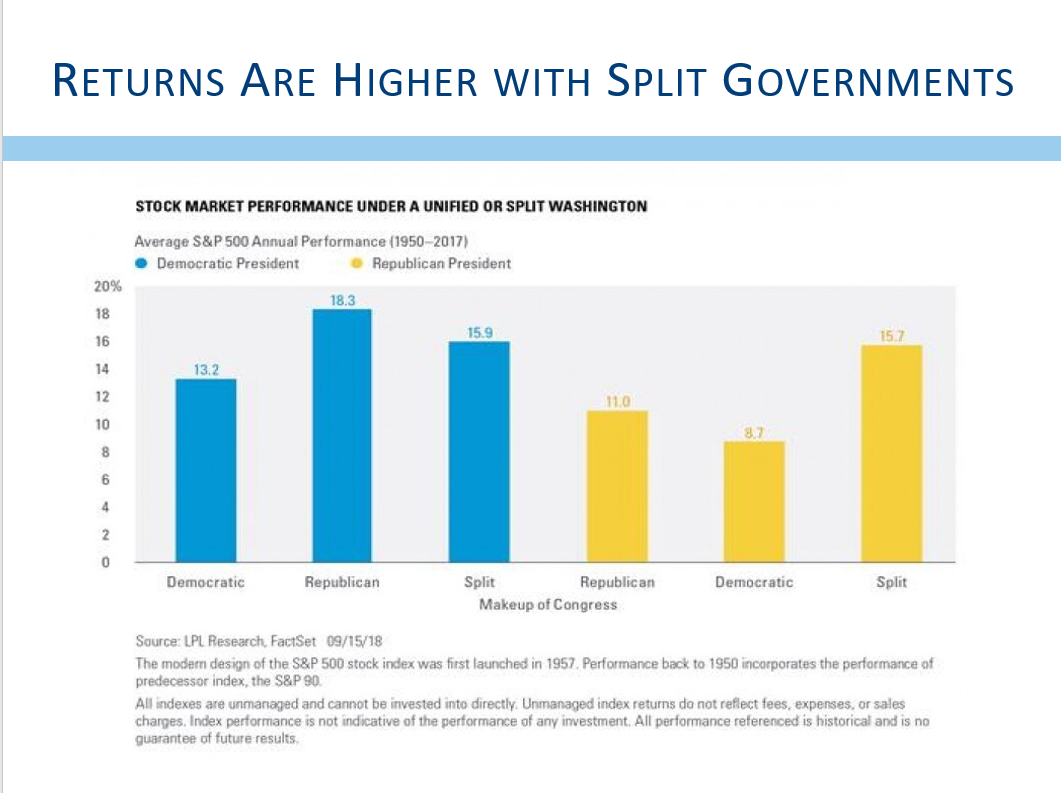
Long term market returns actually favor the Democrats. Even when the Hoover years (1928-32) are eliminated, it is still the case that stock market returns have actually been better during Democratic administrations. That seems counter-intuitive considering the more business-friendly policies that tend to dominate Republican platforms.
Admittedly, the best returns have come from periods when we had a Democratic president and a split congress, but returns in periods with a Democratic president and a Democratic congress have far exceeded the returns from periods when we had a Republican president and a Republican congress.
We all remember the worry that the stock market would crash following a Trump election. I remember watching the S&P 500 futures sell-off dramatically once the results of the 2016 election showed that Trump had emerged victorious. By the time the market opened on Wednesday morning, the selling had abated, and the stock market took off.
There have been similar projections of doom and gloom should Elizabeth Warren be elected, and we can’t help but think that the same thing may be happening again. Investors who do not want a Democrat elected are likely to feel as though the return outlook is diminished, just as many people did in advance of Trump’s election. The actual results may be different from what is feared.
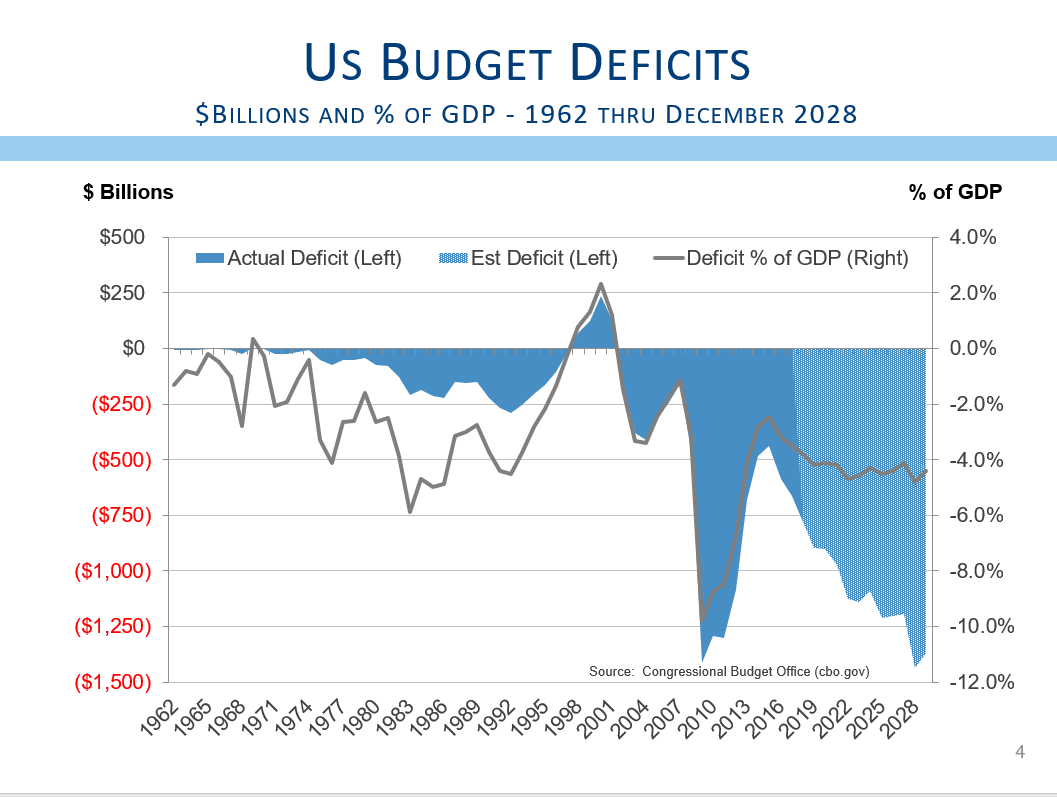
That is not to suggest that the differences between the parties are not significant. The Trump tax cuts led to a dramatic increase in corporate earnings that helped propel stock prices higher. Those tax cuts will create trillion dollar deficits as far as the eye can see, yet no one seems to care. Republicans who used to embrace fiscal restraint seem deaf to the impacts of ever-increasing deficits. Democrats have been heard to complain about the expanding deficits under this administration, but Democrats are not known for their budgetary restraint. Even blue-dog Democrats seem silent about rising deficits. We appreciate that U.S. tax policy is much more competitive globally, but we miss the faction of budget hawks that used to exist.
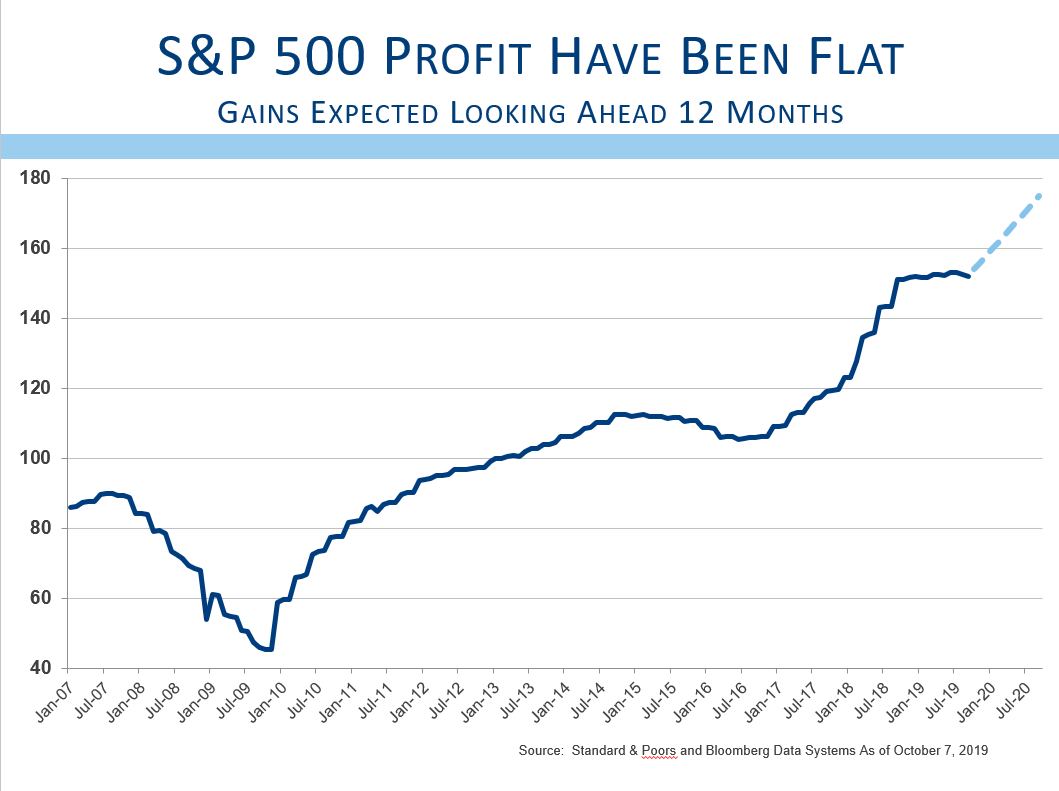
What is interesting about the Trump tax cuts is that corporate earnings have been relatively flat after the initial bump. Faster economic growth does not seem to be materializing. On the other hand, some Democratic presidential candidates have suggested the Trump tax cuts should be reversed. That would reverse the growth in corporate earnings seen early in the Trump administration, and could easily lead to a stock market decline, even if it might be a temporary one.
Trump’s signature policy goal of making trade with the Chinese more fair is quite admirable. It is one thing to give your friend who is a beginner golfer a stroke a hole to help make the game more competitive. It is another thing entirely to continue that policy even as your friend has become as good as you.
Perhaps policies designed to help China become a stronger global competitor were appropriate when China first joined the World Trade Organization (WTO), but now that China is the second largest economy in the world, their need for assistance has diminished markedly.
When we review the tenants of the American trade position, many aspects seem reasonable. The U.S. seeks to end the theft of intellectual property; to end the forced transfer of technology in order to gain access to the Chinese market; to stop Chinese hacking our computers; to stop targeting American businesses and industries for closure; to stop subsidizing state-owned industries; to stop currency manipulation; and to stop sending Chinese-made opioids to our country. Obviously, the difficulty is in the details, and it does seem that winning a trade war may not be as easy as Trump initially envisioned.
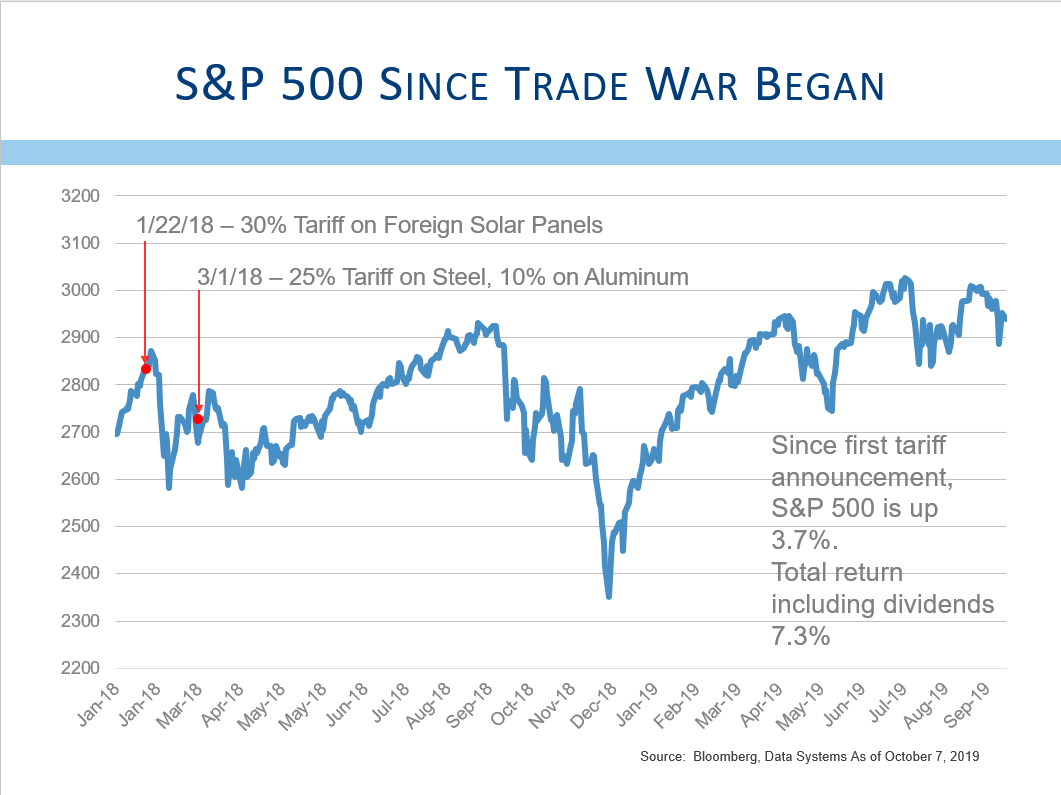
The stock market has ridden the highs and lows of potential trade negotiations. When the news seems to suggest an agreement is likely, stock prices rise significantly. When it seems as though a trade agreement is less likely, the stock market tends to fall precipitously. It seems quite apparent to businesses of all political persuasion that the President’s policies have created huge uncertainty. With 13 months until the presidential election, some even think that any announced trade deal might be more political in nature, and might not reduce the uncertainty that so many businesses currently face.
What we do know is that manufacturing sectors of most world economies are struggling. In August, the Purchasing Managers Index for the U.S. manufacturing economy fell into contraction. The September report fell even further. From a high of 60.8 last August, the most recent report shows an index value of only 47.8. This index moves about the midpoint of 50, so numbers above 50 indicate growth while numbers below 50 indicate contraction. For the second time in as many months, the manufacturing sector of our economy is contracting.
Countries that depend more on manufacturing and more on trade are consistently seeing their manufacturing sectors contract. Germany’s manufacturing sector has been contracting all year, and the recent index reading of 41.7 is lower than it was during the Great Recession. The Global index shows a manufacturing recession, as does Spain’s, Italy’s, the Eurozone’s, and Japan’s.
While Germany’s economy has contracted during the latest period, many other nations have, so far, avoided falling into recession, despite the manufacturing weakness. Consumer spending and retail sales have held up quite well in the U.S. Car sales have been stuck in range of about 17 million cars per year, and consumer spending and retail sales have been reasonably solid.
The uncertainty over trade has trapped the stock market into a trading range. From the announcement of the first tariffs on January 22nd of 2018, the stock market is up less than 4%. Add in dividends and the total return of the market has been a little more than 7% in 20 months, or about 4.2% per year.
Perhaps it is unfair to suggest that the lackluster gains for the stock market are due solely to the uncertainty over trade. We do know that corporate earnings have stopped growing for the past 13 months. There are many factors that have contributed to this stagnation. Higher wages may be impacting corporate margins. Slower economic growth both here and abroad is leading to slower revenue growth. Additionally, competitive pressures remain quite intense, and without any pricing power, companies are seeing profitability suffer.
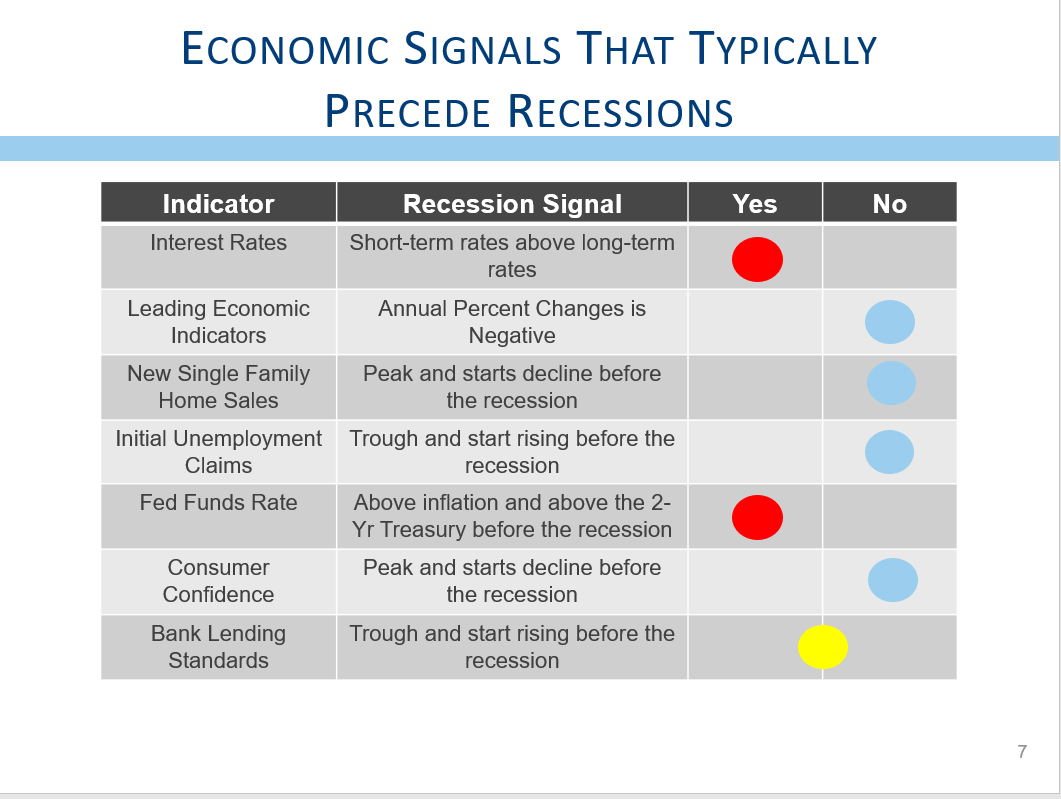
Further, this past quarter has seen significantly greater concern over the potential for a recession in the near future. That was caused, in part, when 2-year government interest rates rose above 10-year rates. Normally investors would expect longer-maturity bonds to provide a higher interest rate, and when that relationship is backwards, we call it an inverted yield curve. Inverted yield curves have been very good indicators of when to expect a recession.
There are several interest rate relationships that have been good predictors of when a recession might be on the horizon. We mentioned the 2-year to 10-year spread, and while that spread dipped below zero in August, it has returned to a positive spread, albeit a very modest one. However, 3 month interest rates remain above 10-year rates, another potential recession indicator. That spread has been negative for several months. We also look at the Fed Funds rate compared with the 2-year treasury rate, and that relationship is also suggesting a recession could be on the horizon.
There are several other indicators that typically rollover in anticipation of a recession, and here the news is more sanguine. The Leading Economic Indicators usually turns negative as compared with the level a year ago, and that has not happened. Consumer confidence typically rolls over prior to a recession, but confidence remains fairly strong. The unemployment rate typically bottoms before a recession starts, and the number of initial unemployment claims also starts to increase prior to the start of a recession. The unemployment rate recently dropped to new cycle lows, and initial unemployment claims remain near multi-decade lows. New single family home sales typically peak well before a recession, and banks significantly tighten their lending standards well before the start of a recession. All of these indicators are not confirming that a recession is on the horizon, at least not yet.
The other thing to consider about using interest rates as a recession indicator is that these signals typically come many months or even many quarters before the start of the slowdown. There is virtually no prospect for a recession before Thanksgiving or Christmas. In fact, with the first yield curve inversion coming in May, a recession is not likely before the middle of next year at the earliest.
One topic we feel compelled to touch on is the historic impact of a presidential impeachment on the markets. The house has only voted to impeach the president three times in our history. The first was in 1868 when the house passed articles of impeachment against Andrew Johnson. The Senate failed to convict Johnson who completed his term. While it may be possible to find data about how the stock market behaved during that period, we find those comparisons unimportant.
The second impeachment occurred in 1974 when the House passed three articles against Richard Nixon. The impeachment trial had revealed derogatory information about the President, including the existence of hidden tape recordings of all oval office conversations, and the political tide quickly turned against the President who resigned in August.
The House Judiciary Committee began impeachment hearings in May of 1974, but the economy had already fallen into a recession. From Nixon’s second inauguration to the initiation of impeachment hearings, the stock market fell more than 20%. Markets continued to tumble and fell 48% peak to trough during the ordeal. It is hard to separate the impact of a severe recession from the uncertainty created by the impeachment and resignation of the President, but the pain felt by investors was quite acute.
The third impeachment proceedings occurred in October of 1998. Monica Lewinsky had received immunity in July, and markets fell by 20%. In this case, the vote to begin impeachment proceedings marked the bottom for the stock market and by the end of the year the market was nearly 10% higher than it was at the beginning of the ordeal. In the case of the Clinton impeachment, the economy was very strong, and markets quickly discounted the reality that the Senate would not convict the President. Risks were quantified as being quite modest, and markets seemed to shrug off the event.
There are two things to consider about the potential impact of impeachment hearings on the market. First, the underlying economy was a very important driver in the outcome. Nixon’s impeachment probably exacerbated the weakness already prevalent from the recession. In contrast, the Clinton impeachment was usurped by the strength in the economy, and proved to be a non-event for the market.
Second, and perhaps more important is the fact that markets corrected during both impeachments. Peak to trough decline during the Clinton hearings was still 20%, even as the market ultimately resolved itself upward.
In the case of a potential impeachment of the President, we suspect that there could easily be downside even as it is unlikely the Senate will convict. Further, the economy is doing okay, but growth has certainly slowed. Pressures from manufacturing weakness combined with slower growth abroad and some recessionary indicators increase the concern that an impeachment hearing could coincide with a much slower economy. A recession combined with impeachment has the potential to cause the market to stumble.
When we look at the world through our prism of risk, we tend to focus on several important areas. We see risks as somewhat above average, but not dangerously so. The topics we use to provide input for our Risk Pulse are:
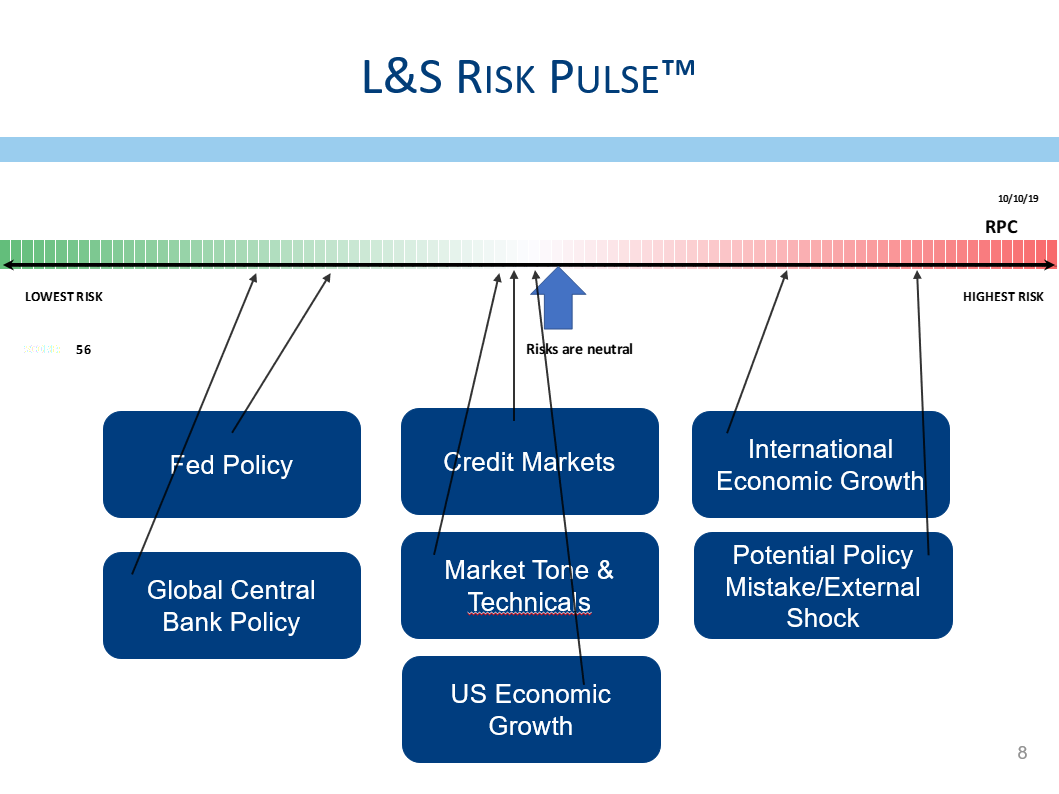
Fed Policy—Perhaps earlier this summer it was easy to suggest the Fed was behind the curve. Growth had slowed, but the Fed was still talking about raising interest rates. Their position has certainly changed, having cut interest rates twice, and the market expects another interest rate cut when they meet at the end of October. Policy is accommodative, and the risks of a policy mistake have diminished significantly.
Global Central Bank Policies—Central bankers around the world have also embraced easy policies. Every global central bank has either held rates steady or has cut rates further. No central banks have been tightening. With accommodative central bankers, risks of a policy mistake seem quite low. Perhaps the only risk is the fact that low or even negative interest rates have not generated sustainable economic growth, and more of the same might not generate a different outcome. Still, risks regarding global central bankers being too tight are small.
Credit Markets—We have found that credit markets tend to be an important indicator of potential problems. We consider the interest rates that borrowers must pay to borrow money. We not only consider high quality borrowers but lower quality ones as well. We look at how the market is pricing risks for sovereign nations, banks, insurance companies, and others. Our experience suggests that risks tend to bubble up to the surface through credit markets. We see no signs of systemic stresses in credit markets. Costs and spreads are higher than they were a few months ago, but remain below the levels that suggest significant stresses. Still, these numbers have moved higher, and we need to remain vigilant that higher costs do not lead to tighter credit markets that prevent companies from operating their businesses.
US Economic Growth—As we mentioned, U.S. economic growth is slow but continues to grow. Signals that a recession may come increase the risk, but without confirmation from other indicators, we see the risk of a recession as somewhat elevated but not troubling.
Global Economic Growth—Global growth remains slow, and the German economy is likely already in recession. Foreign economies do not seem to be getting worse, but very weak growth suggests risks are elevated as any potential shock can shift economies from growth into contraction.
Tone and Techincal Condition of the Market—The market has been held hostage to news regarding the potential for the China trade war to diminish. Fear tends to rise fairly quickly, and there very few speculative excesses. Investors are skeptical and not very bullish. We see market signs as fairly mixed, and risks are roughly average.
Risks of Policy Mistakes and External Shocks—We see the trade war as the potential for a policy mistake, even as risks of a mistake from the Fed have moderated. With drone strikes on Saudi oil production likely coming from Iran, it seems that the risks of a policy mistake or external shock are somewhat above average.
Taken together, we see risks as somewhat above average, but not excessively so.
As always, it is important that we know of any changes in your financial situation. Please feel free to call us if you have any questions or comments regarding your investment portfolio.
Bennett Gross CFA, CAIA
President
Disclosure
L&S Advisors, Inc. (“L&S”) is a privately owned corporation headquartered in Los Angeles, CA. L&S was originally founded in 1979 and dissolved in 1996. The two founders, Sy Lippman and Ralph R. Scott, continued managing portfolios together and reformed the corporation in May 2006. The firm registered as an investment adviser with the U.S. Securities and Exchange commission in June 2006. L&S performance results prior to the reformation of the firm were achieved by the portfolio managers at a prior entity and have been linked to the performance history of L&S. The firm is defined as all accounts exclusively managed by L&S from 10/31/2005, as well as accounts managed in conjunction with other, external advisors via the Wells Fargo DMA investment program for the periods 05/02/2014, through the present time.
L&S claims compliance with the Global Investment Performance Standards (GIPS®). L&S has been independently verified by Ashland Partners & Company LLP for the periods October 31, 2005 through December 31, 2015 and ACA Performance Services for the periods January 1, 2016 to December 31, 2018. Upon a request to Sy Lippman at slippman@lsadvisors.com, L&S can provide the L&S Advisors GIPS Annual Disclosure Presentation which provides a GIPS compliant presentation as well as a list of all composite descriptions.
L&S is a registered investment adviser with the U.S. Securities and Exchange Commission (“SEC”) and is notice filed in various states. Any reference to or use of the terms “registered investment adviser” or “registered,” does not imply that L&S or any person associated with L&S has achieved a certain level of skill or training. L&S may only transact business or render personalized investment advice in those states and international jurisdictions where we are registered, notice filed, or where we qualify for an exemption or exclusion from registration requirements. Information in this newsletter is provided for informational purposes only and should not be construed as a solicitation to effect, or attempt to effect, either transactions in securities or the rendering of personalized investment advice. Any communications with prospective clients residing in states or international jurisdictions where L&S and its advisory affiliates are not registered or licensed shall be limited so as not to trigger registration or licensing requirements. Opinions expressed herein are subject to change without notice. L&S has exercised reasonable professional care in preparing this information, which has been obtained from sources we believe to be reliable; however, L&S has not independently verified, or attested to, the accuracy or authenticity of the information. L&S shall not be liable to customers or anyone else for the inaccuracy or non-authenticity of the information or for any errors of omission in content regardless of the cause of such inaccuracy, non-authenticity, error, or omission, except to the extent arising from the sole gross negligence of L&S. In no event shall L&S be liable for consequential damages.
The S&P 500 index is a free-float market capitalization weighted index of 500 of the largest U.S. companies. The index is calculated on a total return basis with dividends reinvested and is not available for direct investment. The composition of L&S’ strategies generally differs significantly from the securities that comprise the index due to L&S’ active investment process and other variables. L&S does not, and makes no attempt to, mirror performance of the index in the aggregate, and the volatility of L&S’ strategies may be materially different from that of the referenced indices.
L&S’ current disclosure statement as set forth in ADV 2 of Form ADV as well as our Privacy Notice is available for your review upon request.